Simple Trend Following Strategy applied to ETH Spot
Published:
Background
In this project, we explore the feasibility of backtesting a simple trend-following strategy using 2 exponentially-weighted moving averages. Moving averages are commonly used to generate systematic buy-sell-hold signals in traditional markets. When the fast exponential moving average > slow exponential moving average, this indicates upward price momentum, and the reverse would indicate downward price momentum.
Here, we attempt to implement a backtest using ETH Spot, using data from 28 March 2020 to 1 November 2021.
Setup
- ETH Hourly OHLCV data is collected using the FTX API
- Create slow and fast exponential moving averages using different half-lives
- Generate positions based on difference between the fast and slow exponential moving averages
- Backtest over sample period and check PnL metrics
- Generate half-life parameter field to identify regions of positive sharpe
- Verify results using out-of-sample data
Implementation
Since we are using hourly OHLCV bars, the shortest trade interval must be > 1 hour. We backtest our strategy with the following initial arbitrary parameters:
- Fast Half-life: 1 Hour
- Slow Half-life: 5 Hours
We obtain the cumulative returns shown in Figure 1.
Figure 1: Cumulative Returns from Strategy vs Asset

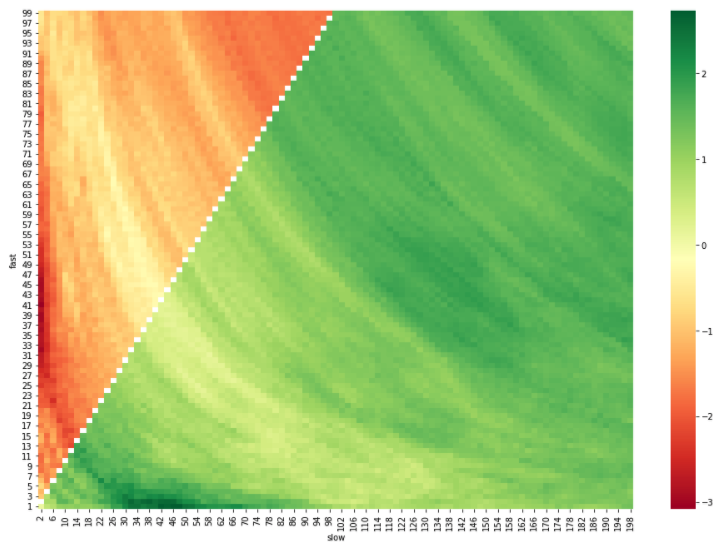
Figure 1 clearly shows an underperformance with the initial half-life parameters. To gain a general understanding of performance, we iterate across a wide range of half-life parameters for fast and slow exponential moving averages - to generate a sharpe field. A green label indicates positive sharpe, while a red label indicates negative sharpe. We can then visually identify regions in the parameter space indicating a positive sharpe.
Figure 2: Sharpe Field with varying fast and slow exponential half-lives

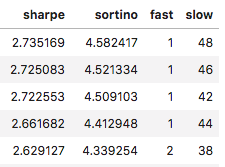
We can then identify the regions in the parameter space that generates the highest sharpe ratios, and have found that the best combinations tend to involve a fast half-life of ~1, and a slow half-life from 40 to 48.
Figure 3: Results Summary - Top 5 Sharpe

Clearly, there is more room for exploration with different spot assets and candlestick intervals. The selection of asset to trade on would depend on factors such as market liquidity, performance, and fund mandate.
Limitations
Nonetheless, any performance metrics calculated using the above backtest methodology would have been an overestimate due to the presence of slippage, transaction cost, and other execution-related inefficiencies. It would thus be necessary to select parameters that would have resulted in the highest sharpes, as combinations of parameters which would lead to seemingly slightly positive sharpe ratios would actually be negative in practice.
